Minor League Baseball Statistics 2026 [Attendance, Leaders, Records and ABS Data]
Andrew Fischer’s 48 home runs topped the minors in 2026, the most by any minor leaguer since 1982. Turnstiles moved the other way, with announced attendance slipping to 29,984,636 across the 120 affiliated clubs.
This guide collects the final 2026 Minor League Baseball statistics: hitting and pitching leaders, attendance by season, league and club, and the 2025 Triple-A data behind the ABS challenge system.
Minor League Baseball Statistics
Who Led Minor League Baseball in Hitting in 2026?
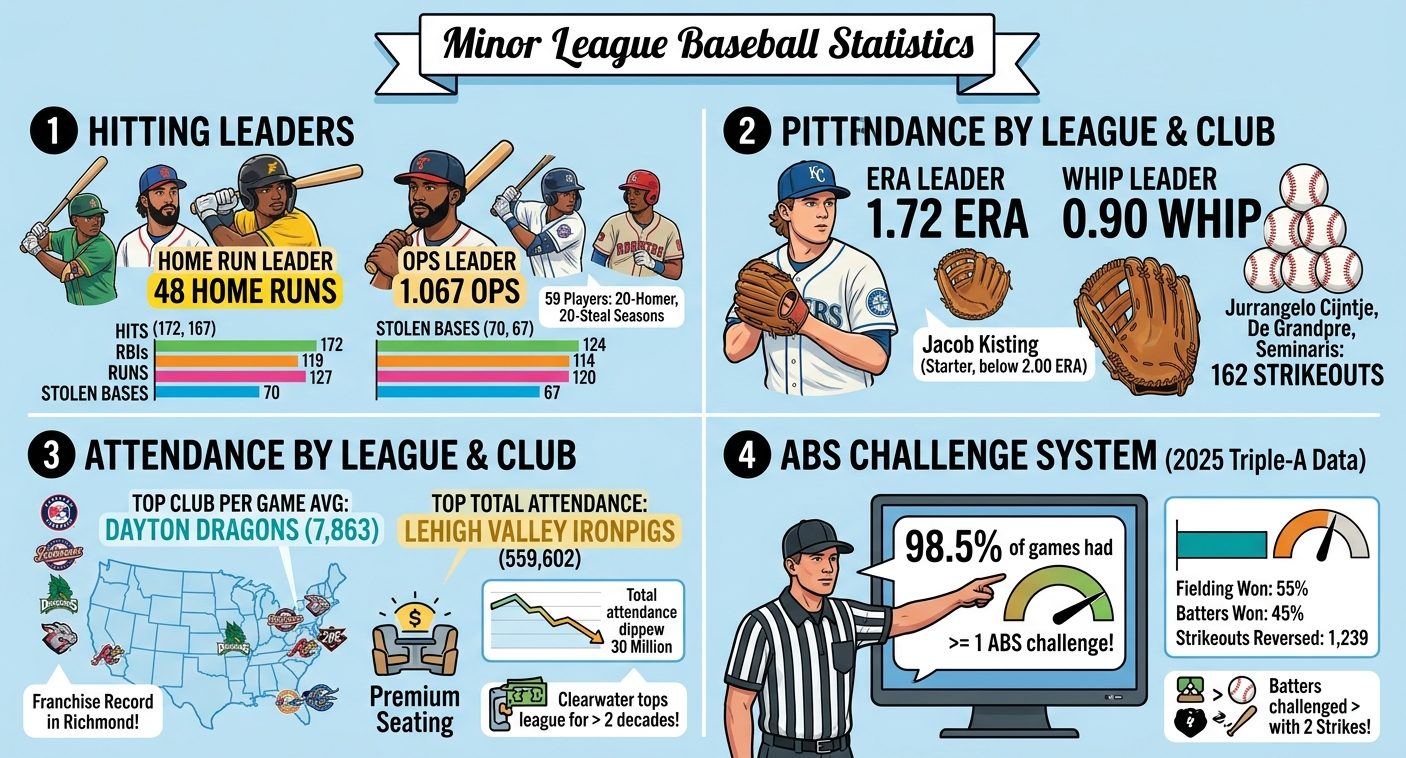
Andrew Fischer led the minors in home runs and OPS, and Kane Kepley topped both runs and stolen bases. Qualifying hitters needed 2.7 plate appearances per scheduled league game, MLB.com notes.
Turner Hill led the minors in batting average at .352 and made his Giants debut on Aug. 15. Fischer’s 1.067 OPS ranked first, ahead of Easton Shelton (1.047) and Zac Veen (1.037).
Ryan Fitzgerald, 32, collected 172 hits without leaving Triple-A Oklahoma City. Emil Morales, 20, drove in 119 runs between Single-A and High-A.
| Category | Leader | Total | Runner-up | Total |
|---|---|---|---|---|
| Hits | Ryan Fitzgerald (Dodgers) | 172 | Devin Taylor (Athletics) | 167 |
| Home runs | Andrew Fischer (Brewers) | 48 | Jesús Báez (Cardinals) | 39 |
| RBIs | Emil Morales (Dodgers) | 119 | Andrew Fischer (Brewers) | 114 |
| Runs | Kane Kepley (Cubs) | 127 | Zach Ehrhard (Dodgers) | 120 |
| Stolen bases | Kane Kepley (Cubs) | 70 | Asbel Gonzalez (Royals) | 67 |
| Extra-base hits | Caleb Bonemer (White Sox), Hunter Fitz-Gerald (Mariners) | 69 | Andrew Fischer (Brewers), Brett Squires (Royals) | 68 |
Andrew Fischer’s 48 Home Runs in Context
Fischer hit 20 home runs in 54 games at High-A Wisconsin and 28 in 72 games at Double-A Biloxi. MLB.com ranks the total as the most this century and fifth in the minors’ modern era.
Jesús Báez finished second with 39. Billy Amick and Lazaro Montes tied at 38, with Caleb Bonemer and Easton Shelton at 37.
No minor leaguer had hit more since Ron Kittle’s 50 for Edmonton in 1982, according to Baseball America. The same outlet says Fischer became the first minor leaguer since Kris Bryant in 2014 to out-homer that year’s MLB home run leader.
His .413 on-base percentage came with 102 walks in 126 games. He also had a three-homer game for Biloxi on Aug. 27.
59 Players Reached 20-20
Fifty-nine minor leaguers had 20-homer, 20-steal seasons in 2026, one fewer than the previous two highest single-season marks combined. Two players reached 30-30, the first to do it since 2023.
Kepley, the Cubs’ 2025 second-round pick, stole 70 bases in 76 attempts between High-A and Double-A. His 120 walks in 125 games lifted a .243 hitter to a .422 on-base percentage.
Jacob Kisting’s 1.72 ERA Tops 2026 Minor League Pitching Statistics
| Rank | Pitcher | Organization | ERA |
|---|---|---|---|
| 1 | Jacob Kisting | Marlins | 1.72 |
| 2 | Joseph Dzierwa | Orioles | 2.27 |
| 3 | Dalton Pence | Rangers | 2.51 |
| 4 | Carson Fischer | Nationals | 2.53 |
| 5 | David Hagaman | D-backs | 2.87 |
Kisting was the only starter in the minors to finish below 2.00, allowing 21 earned runs in 110 innings with 127 strikeouts. The Marlins acquired him at the trade deadline, his third organization since the Twins drafted him in 2024.
Joseph Dzierwa led in WHIP at 0.90, with Kisting second at 0.91, and held hitters to a .186 average. He struck out 149 and walked 30 in 131 innings.
Baltimore took Dzierwa in the second round in 2025, and he did not debut as a pro until this season. This year’s draft-class data sits in our MLB Draft League statistics.
Jonathan Santucci of the Mets led with 163 strikeouts in 125 innings over 27 starts. Three pitchers tied for second at 162: Jurrangelo Cijntje, Cedric De Grandpre and Adam Seminaris.
Braves right-hander Brett Sears led in K-BB% at 24.3%.
Kade Anderson’s 1.06 ERA over 93 1/3 innings was the lowest at that workload since 1971. His Aug. 22 call-up to the Mariners left him short of the innings needed to qualify.
Minor League Baseball Attendance by Season, 2023–2026
The 120 affiliated clubs drew 29,984,636 fans in announced attendance in 2026, down from 30,365,760 in 2025. Baseball America described it as the first full season under 30 million in decades and the third straight annual decline.
Per-game attendance fell by 53 fans, from 3,848 to 3,795, although 2026 lost fewer games to cancellations than 2025.
That average stood at 4,077 in 2023 and 3,962 in 2024. The 2023 total of 32.148 million remains the high point for the 120-team structure.
Just 36 clubs drew more fans per game than in 2025, and 31 lost more than 250 per game.
Operators told Baseball America the dip has not caused alarm, since revenue growth now leans on dynamic pricing and premium seating more than raw crowd size.
These figures cover affiliated clubs alone; partner-league crowds are tracked in our Atlantic League statistics.
Which Minor League Club Drew the Most Fans in Each League?
| League | Level | Leader | Total | Per game |
|---|---|---|---|---|
| International | Triple-A | Lehigh Valley IronPigs | 559,602 | 7,772 |
| Pacific Coast | Triple-A | Albuquerque Isotopes | 502,073 | 6,785 |
| Eastern | Double-A | Richmond Flying Squirrels | 468,961 | 7,105 |
| Southern | Double-A | Chattanooga Lookouts | 336,312 | 5,020 |
| Texas | Double-A | Frisco RoughRiders | 358,699 | 5,435 |
| Midwest | High-A | Dayton Dragons | 511,123 | 7,863 |
| Northwest | High-A | Vancouver Canadians | 276,766 | 4,324 |
| South Atlantic | High-A | Greenville Drive | 305,320 | 4,697 |
| California | Single-A | Fresno Grizzlies | 272,875 | 4,198 |
| Carolina | Single-A | Charleston RiverDogs | 266,343 | 4,162 |
| Florida State | Single-A | Clearwater Threshers | 163,435 | 2,594 |
Lehigh Valley led the minors in total attendance for the 10th time. Indianapolis (555,657), Columbus (511,810), Dayton and Albuquerque also topped 500,000.
Dayton led all 120 teams in per-game average and was the only club among the 90 below Triple-A to reach 500,000. Its Day Air Ballpark sellout streak, running since 2000, has passed 1,700 games.
Home schedules differ by level, with 75 scheduled dates at Triple-A, 69 at Double-A and 66 at High-A and Single-A. For crowds outside affiliated ball, see our Banana Ball Championship League statistics.
Richmond set a franchise record in CarMax Park’s first season, the highest Eastern League total since Reading’s 469,105 in 2005. Chattanooga’s attendance rose 76% after its move to Erlanger Park.
Greenville led the South Atlantic League for a seventh straight year, and Clearwater has topped the Florida State League for more than two decades.
Biggest Per-Game Gains and Drops in 2026
Ontario averaged 4,063 in its first California League season, 2,745 more per game than Modesto drew in 2025. Chattanooga added 1,664 per game after opening its new ballpark.
Frederick drew 1,423 more per game than Aberdeen after returning to affiliated ball as an Orioles club. Tampa gained 659 back at its home ballpark, and Fresno added 536.
Winston-Salem posted the largest decline at 1,012 fans per game. Greensboro (825), Lansing (655), Corpus Christi (529) and the Columbus Clingstones (505) followed.
9,432 ABS Challenges: What 2025 Triple-A Data Shows
ABS challenges showed up in 98.5% of 2025 Triple-A games. One game in six had four or more overturned calls, and 61% had two or fewer.
Overturns came almost exactly half the time. Fielding teams won nearly 55% of their challenges, while batters won 45%.
MLB moved the system into regular-season and postseason play in 2026 after testing it in the minors, spring training and the All-Star Game.
| Event | 2025 Triple-A total |
|---|---|
| Pitches thrown | Just over 861,000 |
| ABS challenges | 9,432 |
| Strikeouts reversed by batter challenges | 1,239 |
| Walks reversed by fielding-team challenges | 584 |
| Full-count calls flipped between strikeout and walk | 323 |
Just over 1% of all Triple-A pitches drew a challenge, and 0.5% were overturned. Among challengeable pitches, 3% were challenged.
Batters Challenged More With Two Strikes
MLB.com split batter results by count; full counts sit inside the two-strike group.
| Count | Share of challengeable pitches challenged | Batter success rate |
|---|---|---|
| All counts | 4.8% | 45% |
| Two strikes | 20% | 36% |
| Full count | 25% | 34% |
| Other counts | Not reported | 51% |
Fielding teams challenged 2% of challengeable pitches, rising to 4.8% on full counts. Batters were four to five times as likely to challenge with two strikes as in other counts, per MLB.com.
Who Challenged Best in Triple-A?
Davis Schneider of Toronto went 10-2 (83%), the top rate among hitters with at least 10 challenges. Colorado’s Zac Veen went 3-22 (12%), then posted a 1.037 OPS in 2026 that ranked third in the minors.
Louisville catcher PJ Higgins went 48-14 (77%), 28 overturns above expectation in MLB’s model. Las Vegas led batting teams at 54% and Louisville led fielding teams at 68%, while Syracuse ranked last on both sides.
Batters listed at 5-foot-9 or shorter won 50% of their challenges. Both the 5-foot-10 to 6-foot-2 group and the 6-foot-3-and-taller group won 44%.
FAQs
Who hit the most home runs in Minor League Baseball in 2026?
Andrew Fischer of the Brewers system hit 48, split between High-A Wisconsin and Double-A Biloxi. That was the most by a minor leaguer since 1982. Jesús Báez of the Cardinals system ranked second with 39.
Which Minor League team had the highest attendance in 2026?
Lehigh Valley led in total attendance with 559,602, its 10th time topping the minors. Dayton posted the best per-game average at 7,863 and was the only club below Triple-A to pass 500,000.
How many people attend Minor League Baseball games each year?
Announced attendance totaled 29,984,636 across the 120 affiliated clubs in 2026, or 3,795 fans per game, according to Baseball America. That was down from 30,365,760 in 2025.
How many teams are in Minor League Baseball?
Minor League Baseball has 120 affiliated clubs, and 90 of them play below Triple-A. Partner circuits such as the Pioneer League sit outside that count.
Reddit threads say Minor League crowds are shrinking. Is that true?
Yes. Announced attendance fell for a third straight season in 2026, and only 36 of the 120 clubs drew more fans per game than in 2025, Baseball America reported.
Sources
https://www.baseballamerica.com/stories/2026-milb-attendance-numbers-for-all-120-teams/
https://www.mlb.com/news/minor-league-baseball-statistical-leaders-2026
https://www.mlb.com/news/2026-minor-league-attendance-leaders
https://www.mlb.com/news/abs-challenge-system-statistical-breakdown-2025